ไปยังเนื้อหาหลัก

วิธีคำนวณอัตราการเติบโตเฉลี่ยต่อปีใน Excel

บทความนี้กำลังพูดถึงวิธีการคำนวณอัตราการเติบโตเฉลี่ยต่อปี (AAGR) และอัตราการเติบโตต่อปี (CAGR) ใน Excel


คำนวณอัตราการเติบโตต่อปีใน Excel

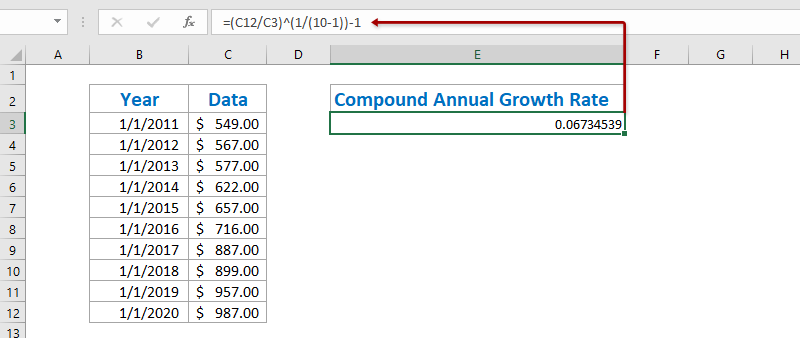
ในการคำนวณอัตราการเติบโตต่อปีแบบผสมใน Excel มีสูตรพื้นฐาน = ((มูลค่าสิ้นสุด / มูลค่าเริ่มต้น) ^ (1 / ช่วงเวลา) -1. และเราสามารถใช้สูตรนี้ได้อย่างง่ายดายดังต่อไปนี้:

1. เลือกเซลล์ว่างตัวอย่างเช่นเซลล์ E3 ป้อนสูตรด้านล่างลงไปแล้วกด เข้าสู่ สำคัญ. ดูภาพหน้าจอ:

=(C12/C3)^(1/(10-1))-1

หมายเหตุ: ในสูตรข้างต้น C12 คือเซลล์ที่มีค่าสิ้นสุด C3 คือเซลล์ที่มีค่าเริ่มต้น 10-1 คือช่วงเวลาระหว่างค่าเริ่มต้นและค่าสิ้นสุดและคุณสามารถเปลี่ยนแปลงได้ตามความต้องการของคุณ

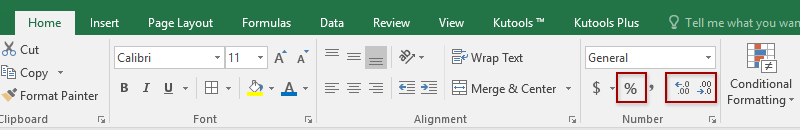
2. ในบางกรณีผลการคำนวณอาจไม่จัดรูปแบบเป็นเปอร์เซ็นต์ โปรดเลือกผลการคำนวณต่อไปคลิกที่ รูปแบบเปอร์เซ็นต์ ปุ่ม  บน หน้าแรก เพื่อเปลี่ยนตัวเลขเป็นรูปแบบเปอร์เซ็นต์จากนั้นเปลี่ยนตำแหน่งทศนิยมโดยคลิกที่ เพิ่มทศนิยม ปุ่ม  or ลดทศนิยม ปุ่ม . ดูภาพหน้าจอ:


คำนวณอัตราการเติบโตต่อปีด้วยฟังก์ชัน XIRR ใน Excel

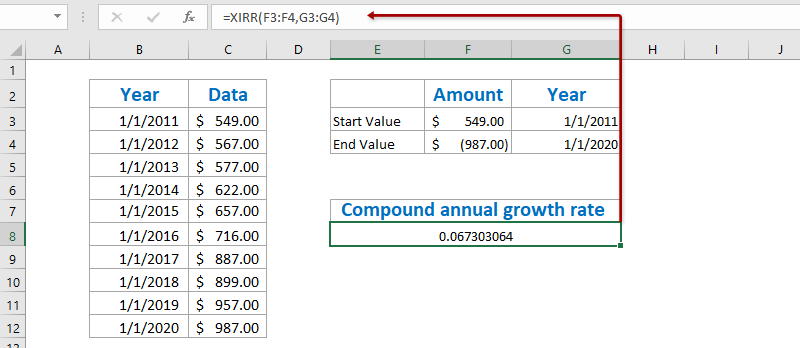
ที่จริงแล้วฟังก์ชัน XIRR สามารถช่วยให้เราคำนวณอัตราการเติบโตต่อปีแบบผสมใน Excel ได้อย่างง่ายดาย แต่คุณต้องสร้างตารางใหม่ที่มีค่าเริ่มต้นและค่าสิ้นสุด

1. สร้างตารางใหม่ด้วยค่าเริ่มต้นและค่าสิ้นสุดตามภาพหน้าจอแรกที่แสดงดังต่อไปนี้:

หมายเหตุ: ในเซลล์ F3 ให้ป้อน = C3 ในเซลล์ G3 ให้ป้อน = B3 ในเซลล์ F4 ให้ป้อน = -C12 และในเซลล์ G4 ให้ป้อน = B12 หรือคุณสามารถป้อนข้อมูลเดิมของคุณลงในตารางนี้ได้โดยตรง ยังไงก็ตามคุณต้องบวกลบก่อนมูลค่าสิ้นสุด

2. เลือกเซลล์ว่างด้านล่างตารางนี้จากนั้นป้อนสูตรด้านล่างลงไปแล้วกด เข้าสู่ กุญแจ

= XIRR (F3: F4, G3: G4)

3. สำหรับการเปลี่ยนผลลัพธ์เป็นรูปแบบเปอร์เซ็นต์ให้เลือกเซลล์ที่มีฟังก์ชัน XIRR นี้คลิกที่ รูปแบบเปอร์เซ็นต์ ปุ่ม  บน หน้าแรก จากนั้นเปลี่ยนตำแหน่งทศนิยมโดยคลิกที่ เพิ่มทศนิยม ปุ่ม  or ลดทศนิยม ปุ่ม . ดูภาพหน้าจอ:

บันทึกตาราง CAGR เป็นเทมเพลตขนาดเล็กอย่างรวดเร็วและใช้ซ้ำได้ในคลิกเดียวในอนาคต

การอ้างอิงเซลล์และใช้สูตรในการคำนวณค่าเฉลี่ยทุกครั้งจะต้องเป็นเรื่องที่น่าเบื่อมาก Kutools สำหรับ Excel มีวิธีแก้ปัญหาที่น่ารักของ ข้อความอัตโนมัติ ยูทิลิตี้เพื่อบันทึกช่วงเป็นรายการ AutoText ซึ่งยังคงเป็นรูปแบบเซลล์และสูตรในช่วง จากนั้นคุณจะใช้ช่วงนี้ซ้ำได้ในคลิกเดียว

ข้อความอัตโนมัติ doc cagr


คำนวณอัตราการเติบโตเฉลี่ยต่อปีใน Excel

ในการคำนวณอัตราการเติบโตเฉลี่ยต่อปีใน excel โดยปกติเราจะต้องคำนวณอัตราการเติบโตต่อปีของทุกปีด้วยสูตร = (ค่าสิ้นสุด - ค่าเริ่มต้น) / ค่าเริ่มต้นแล้วเฉลี่ยอัตราการเติบโตต่อปีเหล่านี้ คุณสามารถทำได้ดังนี้:

1. นอกเหนือจากตารางต้นฉบับให้ป้อนสูตรด้านล่างลงในเซลล์ว่าง C3 และจากนั้นลาก Fill Handle ไปที่ช่วง C3: C11

= (C4-C3) / C3

2. เลือกช่วง D4: D12 คลิก รูปแบบเปอร์เซ็นต์ ปุ่ม  บน หน้าแรก จากนั้นเปลี่ยนตำแหน่งทศนิยมโดยคลิกที่ เพิ่มทศนิยม ปุ่ม  or ลดทศนิยม ปุ่ม . ดูภาพหน้าจอ:

3. เฉลี่ยอัตราการเติบโตต่อปีทั้งหมดโดยป้อนสูตรด้านล่างลงในเซลล์ F4 แล้วกดปุ่ม เข้าสู่ กุญแจ

= ค่าเฉลี่ย (D4: D12)

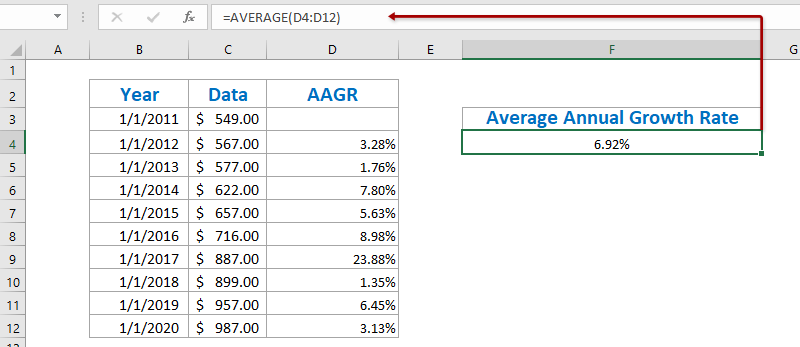
ถึงตอนนี้อัตราการเติบโตเฉลี่ยต่อปีได้รับการคำนวณและแสดงในเซลล์ C12


Demo: คำนวณอัตราการเติบโตเฉลี่ยต่อปีใน Excel


Kutools สำหรับ Excel: เครื่องมือแสนสะดวกกว่า 300 รายการอยู่แค่เพียงปลายนิ้วสัมผัส! เริ่มทดลองใช้ฟรี 30 วันโดยไม่มีข้อจำกัดด้านฟีเจอร์ตั้งแต่วันนี้ Download Now!

บทความที่เกี่ยวข้อง:

สุดยอดเครื่องมือเพิ่มผลผลิตในสำนักงาน

🤖 Kutools AI ผู้ช่วย: ปฏิวัติการวิเคราะห์ข้อมูลโดยยึดตาม: การดำเนินการที่ชาญฉลาด   |  สร้างรหัส  |  สร้างสูตรที่กำหนดเอง  |  วิเคราะห์ข้อมูลและสร้างแผนภูมิ  |  เรียกใช้ฟังก์ชัน Kutools...
คุณสมบัติยอดนิยม: ค้นหา เน้น หรือระบุรายการที่ซ้ำกัน   |  ลบแถวว่าง   |  รวมคอลัมน์หรือเซลล์โดยไม่สูญเสียข้อมูล   |   รอบโดยไม่มีสูตร ...
การค้นหาขั้นสูง: VLookup หลายเกณฑ์    VLookup หลายค่า  |   VLookup ข้ามหลายแผ่น   |   การค้นหาที่ไม่ชัดเจน ....
รายการแบบเลื่อนลงขั้นสูง: สร้างรายการแบบหล่นลงอย่างรวดเร็ว   |  รายการแบบหล่นลงขึ้นอยู่กับ   |  เลือกหลายรายการแบบหล่นลง ....
ผู้จัดการคอลัมน์: เพิ่มจำนวนคอลัมน์เฉพาะ  |  ย้ายคอลัมน์  |  สลับสถานะการมองเห็นของคอลัมน์ที่ซ่อนอยู่  |  เปรียบเทียบช่วงและคอลัมน์ ...
คุณสมบัติเด่น: กริดโฟกัส   |  มุมมองการออกแบบ   |   บาร์สูตรใหญ่    สมุดงานและตัวจัดการชีต   |  ห้องสมุดทรัพยากร (ข้อความอัตโนมัติ)   |  เลือกวันที่   |  รวมแผ่นงาน   |  เข้ารหัส/ถอดรหัสเซลล์    ส่งอีเมลตามรายการ   |  ซุปเปอร์ฟิลเตอร์   |   ตัวกรองพิเศษ (กรองตัวหนา/ตัวเอียง/ขีดทับ...) ...
ชุดเครื่องมือ 15 อันดับแรก12 ข้อความ เครื่องมือ (เพิ่มข้อความ, ลบอักขระ, ... )   |   50 + แผนภูมิ ประเภท (แผนภูมิ Gantt, ... )   |   40+ ใช้งานได้จริง สูตร (คำนวณอายุตามวันเกิด, ... )   |   19 การแทรก เครื่องมือ (ใส่ QR Code, แทรกรูปภาพจากเส้นทาง, ... )   |   12 การแปลง เครื่องมือ (ตัวเลขเป็นคำ, การแปลงสกุลเงิน, ... )   |   7 ผสานและแยก เครื่องมือ (แถวรวมขั้นสูง, แยกเซลล์, ... )   |   ... และอื่น ๆ

เพิ่มพูนทักษะ Excel ของคุณด้วย Kutools สำหรับ Excel และสัมผัสประสิทธิภาพอย่างที่ไม่เคยมีมาก่อน Kutools สำหรับ Excel เสนอคุณสมบัติขั้นสูงมากกว่า 300 รายการเพื่อเพิ่มประสิทธิภาพและประหยัดเวลา  คลิกที่นี่เพื่อรับคุณสมบัติที่คุณต้องการมากที่สุด...

รายละเอียด


แท็บ Office นำอินเทอร์เฟซแบบแท็บมาที่ Office และทำให้งานของคุณง่ายขึ้นมาก

  • เปิดใช้งานการแก้ไขและอ่านแบบแท็บใน Word, Excel, PowerPoint, ผู้จัดพิมพ์, Access, Visio และโครงการ
  • เปิดและสร้างเอกสารหลายรายการในแท็บใหม่ของหน้าต่างเดียวกันแทนที่จะเป็นในหน้าต่างใหม่
  • เพิ่มประสิทธิภาพการทำงานของคุณ 50% และลดการคลิกเมาส์หลายร้อยครั้งให้คุณทุกวัน!
Comments (22)
No ratings yet. Be the first to rate!
This comment was minimized by the moderator on the site
Thank u very much for important scientific information
This comment was minimized by the moderator on the site
How to calculate average of percentage CAGR Return ?
Example :

28.6%

34.9%

25.5%

-2.8%

16.0%
This comment was minimized by the moderator on the site
You can also just use the RATE() formula with setting PMT to 0. RATE(9,0,-549,987) = 6.73%. Built right into Excel already.
This comment was minimized by the moderator on the site
Your period is wrong in CAGR formula ?
This comment was minimized by the moderator on the site
I agree, there's only 9 periods from 1/1/11 to 1/1/20. Ten periods would be 1/1/11 to 12/31/20. Please explain
This comment was minimized by the moderator on the site
Hi - I'm trying to work backwards to find the highest price I can buy a share at when I have a total expected return. Are you able to please help me by reverse engineering the formula to work this out. Using your example - I'm trying to work out what the "3" should be 2.43443 =(3200/x)^(1/(40-8))-1
This comment was minimized by the moderator on the site
Hi,

I have 7 fiscal years of foot traffic data for a retail store:

FY12 FY13 FY14 FY15 FY16 FY17 FY18
2653 2848 2871 2925 2685 2923 3000

My question is: while traffic is increasing, is it increasing at a decreasing rate? Is the growth slowing?


Your first example "(B11/B2)^(1/(10-1))-1" takes the end value and beginning value to get the CAGR. The part I don't understand is that, what about the values in the middle? How does only taking the end and beginning value determine the growth rate accurately? Is there another method where it takes all the fiscal year values into account?
This comment was minimized by the moderator on the site
FY12 - 2653
FY13 - 2848
FY14 - 2871
FY15 - 2925
FY16 - 2685
FY17 - 2923
FY18 - 3000
This comment was minimized by the moderator on the site
Hi Robert,
You can use this formula = (Ending Value - Beginning Value) / Beginning Value to calculate the growth rate of each year, and then compare those growth rates one by one.
This comment was minimized by the moderator on the site
Can someone help with this problem using excel?

The following data show average growth of the human embryo prior to birth.
EMBRYO AGE IN WEEKS WEIGHT IN GRAMS
8 3
12 36
20 330
28 1000
36 2400
40 3200

a). Find the quadratic function of “best fit” for this data. Write this function in standard form: f(x) = ax2 + bx + c.
b). Make a sketch of the scatter plot and the parabola. Plot the quadratic function found above the Y = menu.
c). According to your model, what would a 32-week embryo weigh?
d). According to your model, what week would an embryo weigh 3000 grams?
e). Could the model be used for weight of an embryo for any number of weeks age (such as 100 or 200)? Explain
This comment was minimized by the moderator on the site
Hi Wayne,
You can calculate the Compound Annual Growth Rate with the second method:
=(3200/3)^(1/(40-8))-1
This comment was minimized by the moderator on the site
There is a new tool that will fit to your planning software. MS Excel is a spreadsheet developed by Microsoft for Windows, macOS, Android and iOS. It features calculation, graphing tools, pivot tables, and a macro programming language called Visual Basic for Applications. Thus, it can do Bookkeeping/Accounting, Budgeting (Existing Year and Long Term) and Data Analysis.
This comment was minimized by the moderator on the site
In the CAGR formula, why we are using -1 at the end. I am using two formulaes 1) (I5/I4)^(1/(25-1))-1 2)(I5/I4)^(1/(25)-1) which one is correct..? Please help me out on this thank you.
This comment was minimized by the moderator on the site
The first formula you are using is the correct one!
This comment was minimized by the moderator on the site
The formula is actually CORRECT, but the explanation is incorrect. There are 10 dates that represent 9 periods. It should say that "n-1" means "dates-1", not "periods - 1". You can verify it yourself by increasing each year by this example's n-1 CAGR and you will get the final result.
There are no comments posted here yet
Load More
Please leave your comments in English
Posting as Guest
×
Rate this post:
0   Characters
Suggested Locations